Usage
Below different usage examples:
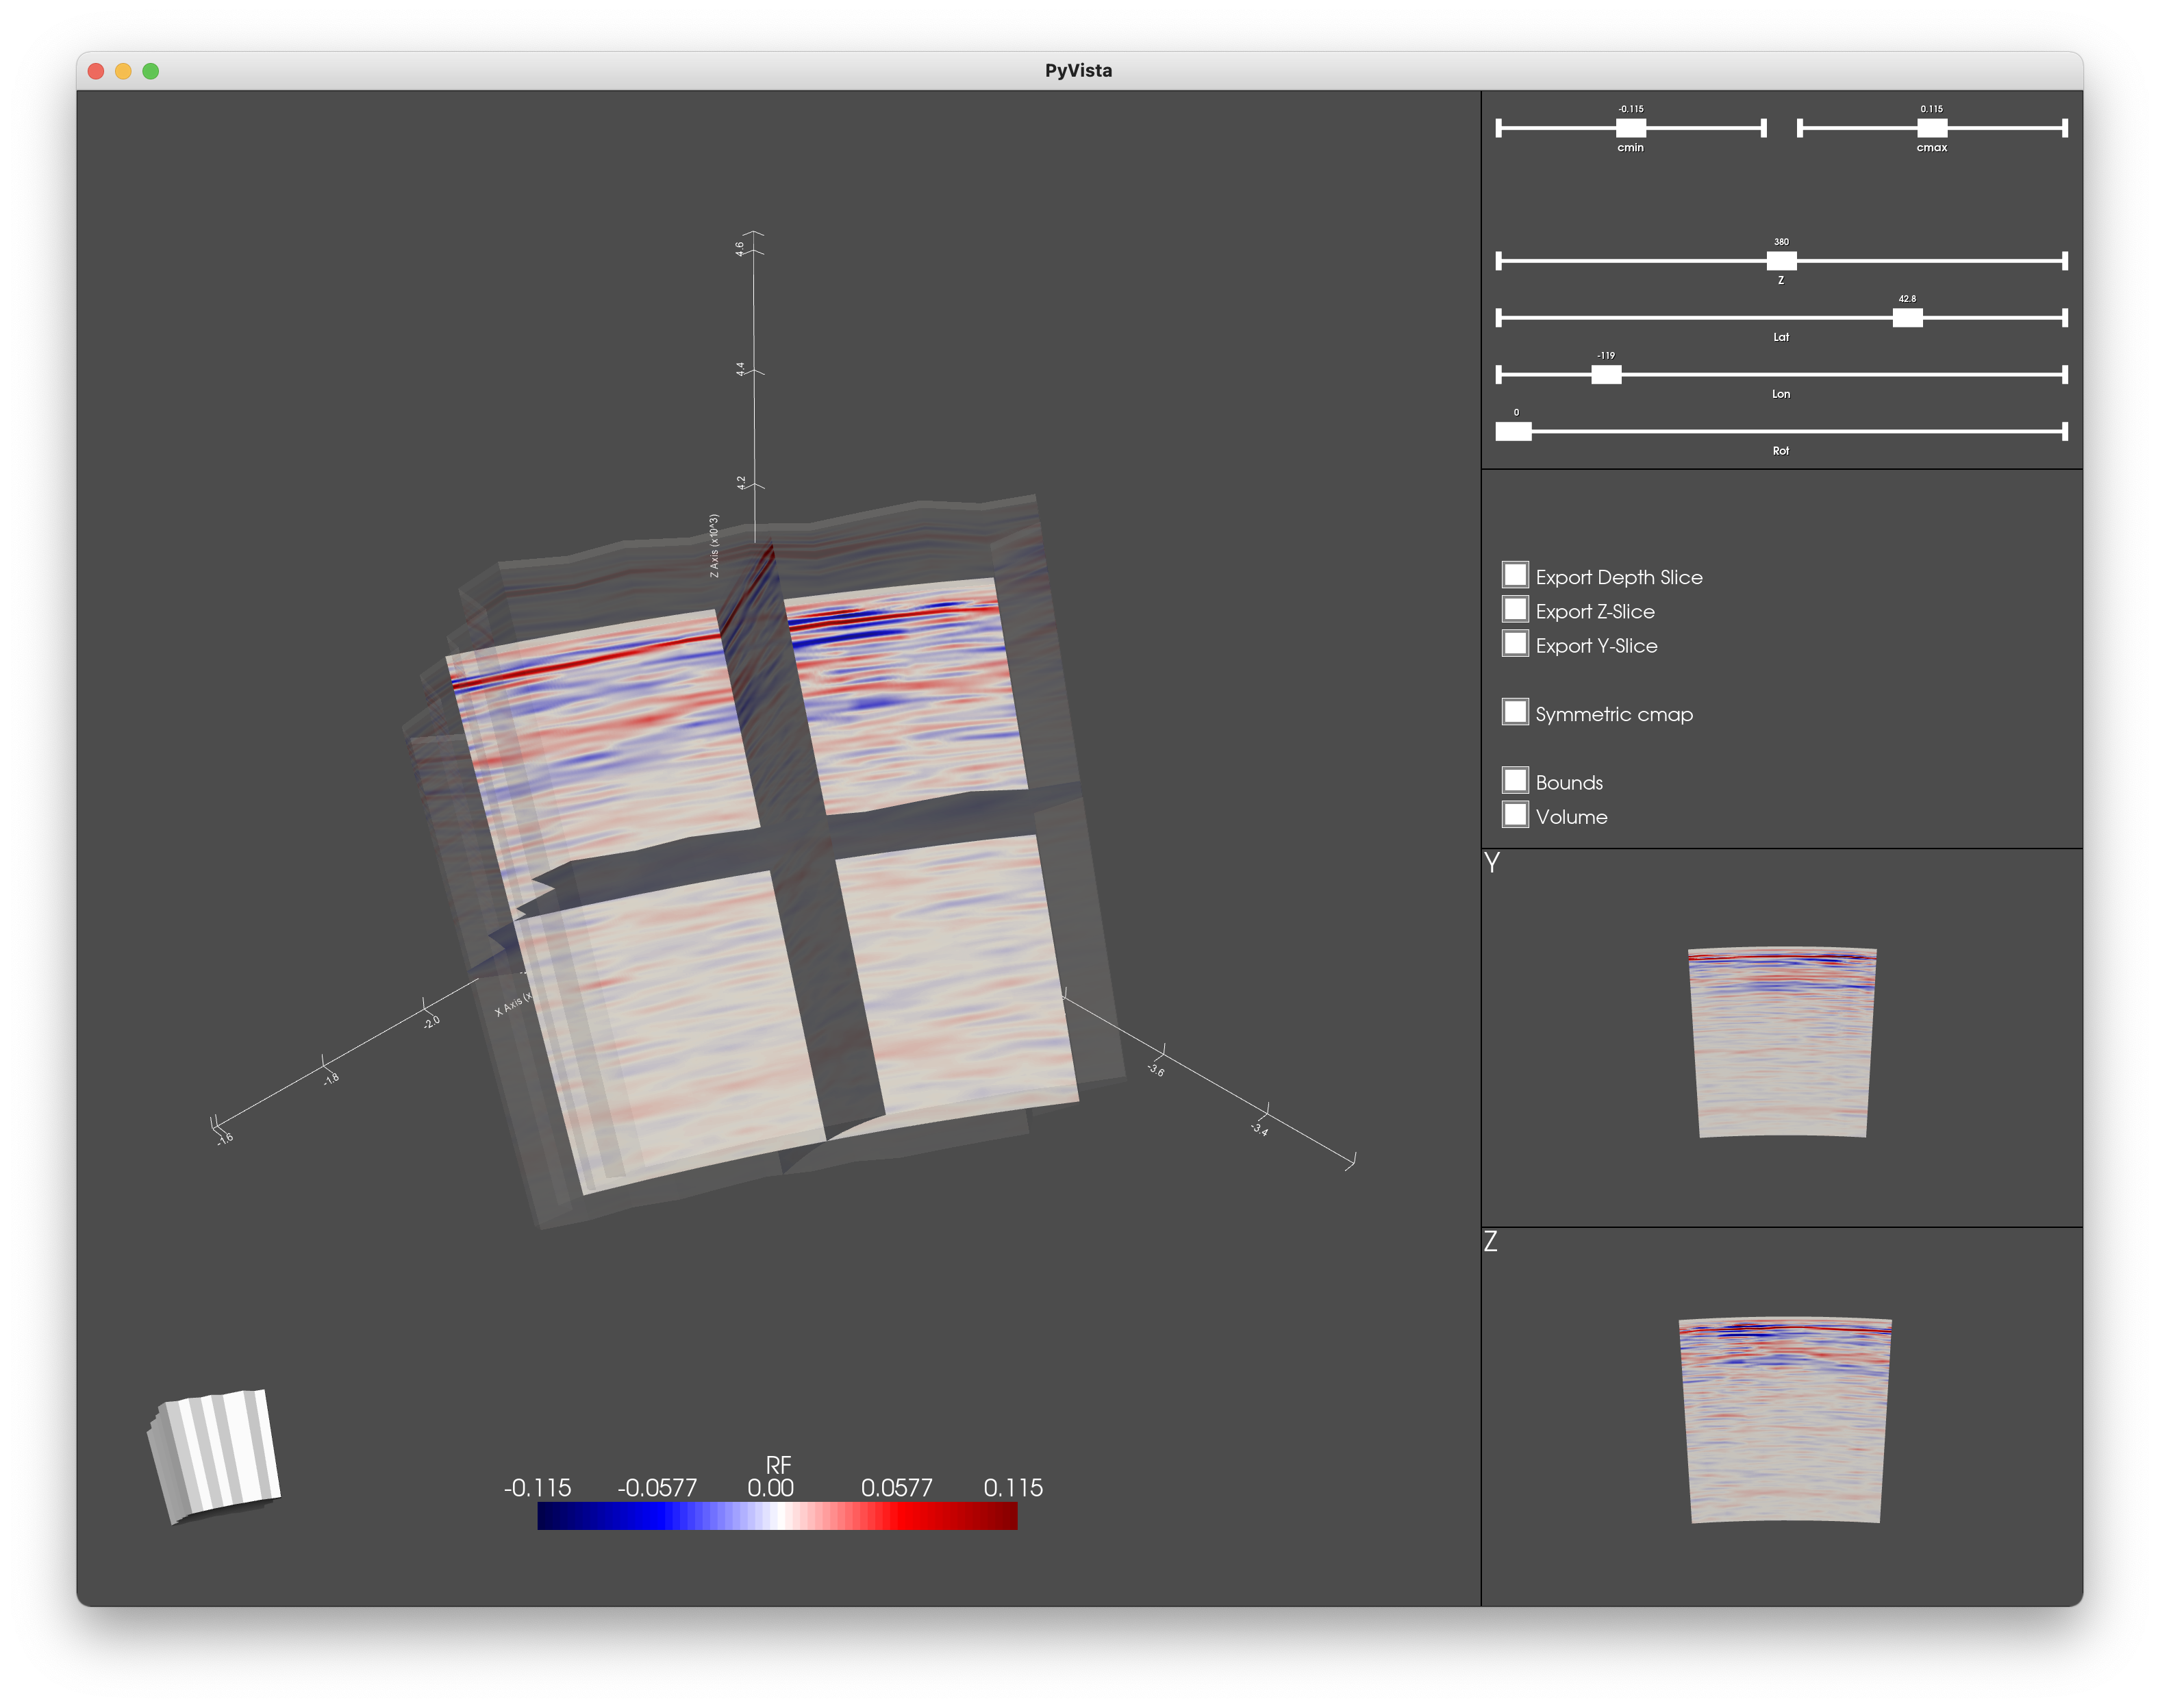
Read and Plot Spherical Plot in window to explore
from meshslice import read_mesh, MeshPlotSph

# Read mesh
M = read_mesh("tests/data/test.vtu")

# Open explorer
MeshPlotSph(M)
Reproducible slices through a 3D volume
Compare slices of two datatypes. Here, illumination and RF.
from meshslice import read_mesh, MeshPlotSph

# Read mesh
M = read_mesh("tests/data/test.vtu")

locations = dict(
    lat=42.8,
    lon=-119.0,
    rotangle=45.0,
    depth=660
)

illum_cdict = dict(
    meshname='illumination',
    cmapname='magma',
    clim = [100, 1200]
)

RF_cdict = dict(
    meshname='RF',
    cmapname='seismic',
    clim = [-0.02, 0.02]
)

MeshPlotSph(M, **locations, **illum_cdict, figures_only=True, fmt='svg')
MeshPlotSph(M, **locations, **RF_cdict, figures_only=True, fmt='svg')


